Sample Report
(classic view)File: public_import.csv • Type: Cloudquant • Direction: Short • Optimizing On: Profit • Dates: 2020-01-01 to 2023-12-28 (1457 days)
Baseline
Top Columns (8)
col8
Condition: col8 >= 10.3836
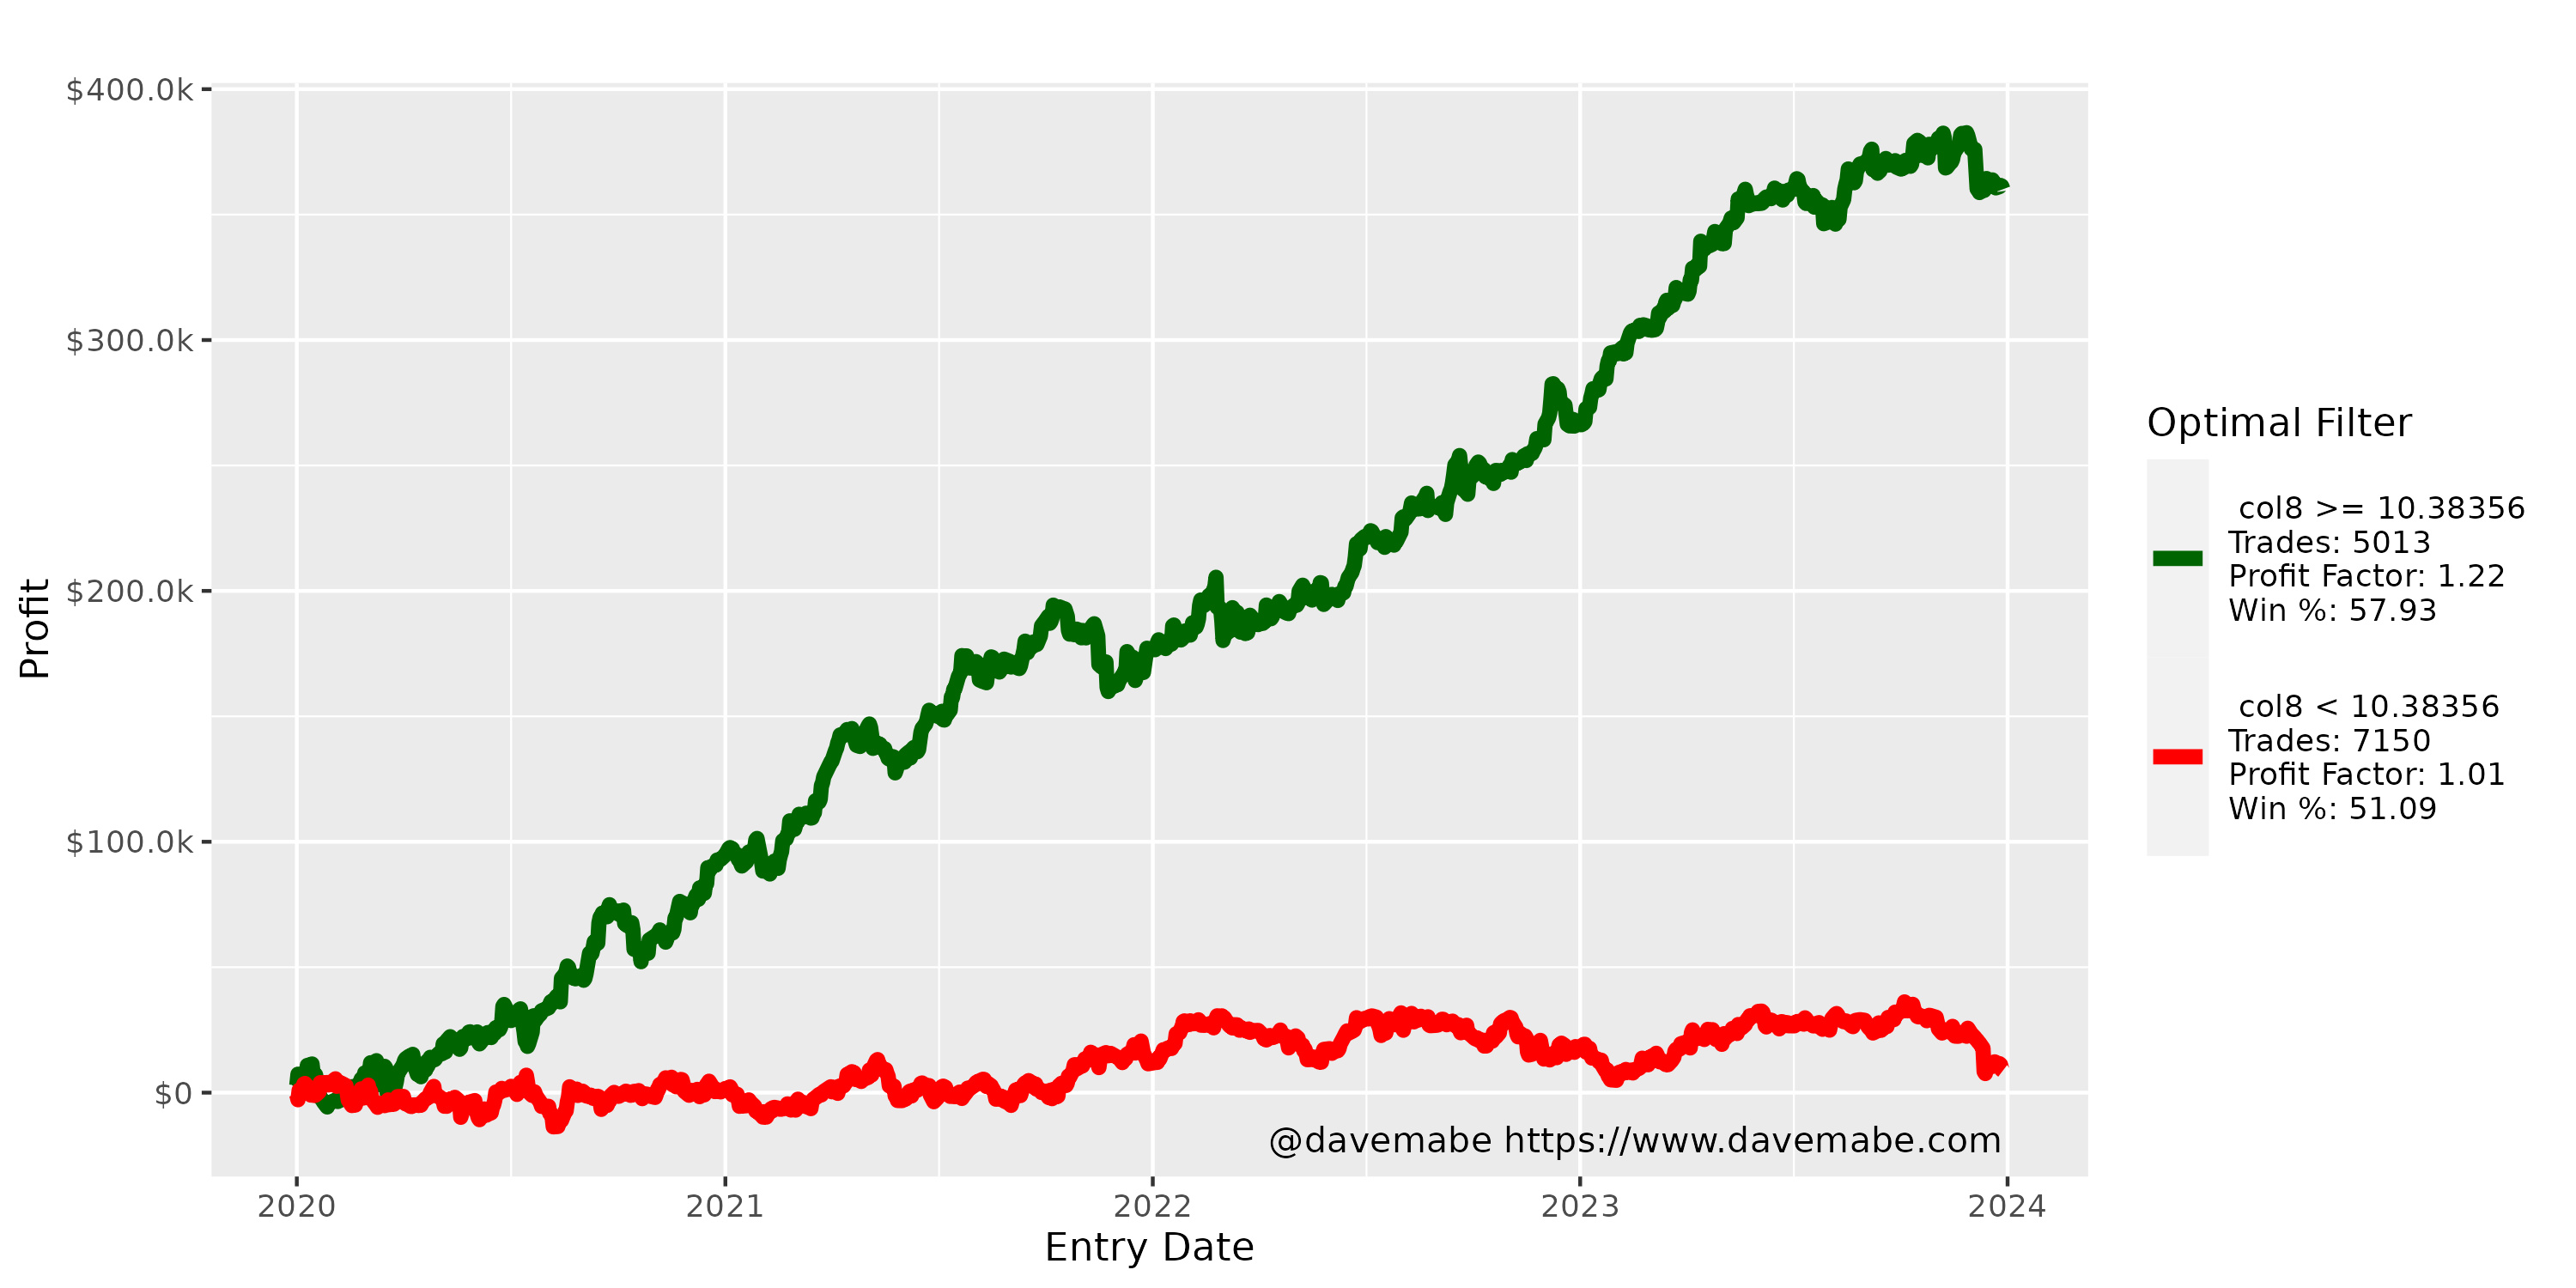
| Metric | Better | Worse |
|---|---|---|
| Trades | 5,013 | 7,150 |
| Total Profit | $360,098 | $8,785 |
| Profit Factor | 1.22 | 1.01 |
| Win Rate | 57.9% | 51.1% |
| Calmar | 10.06 | 0.15 |
col7
Condition: col7 < -0.6790
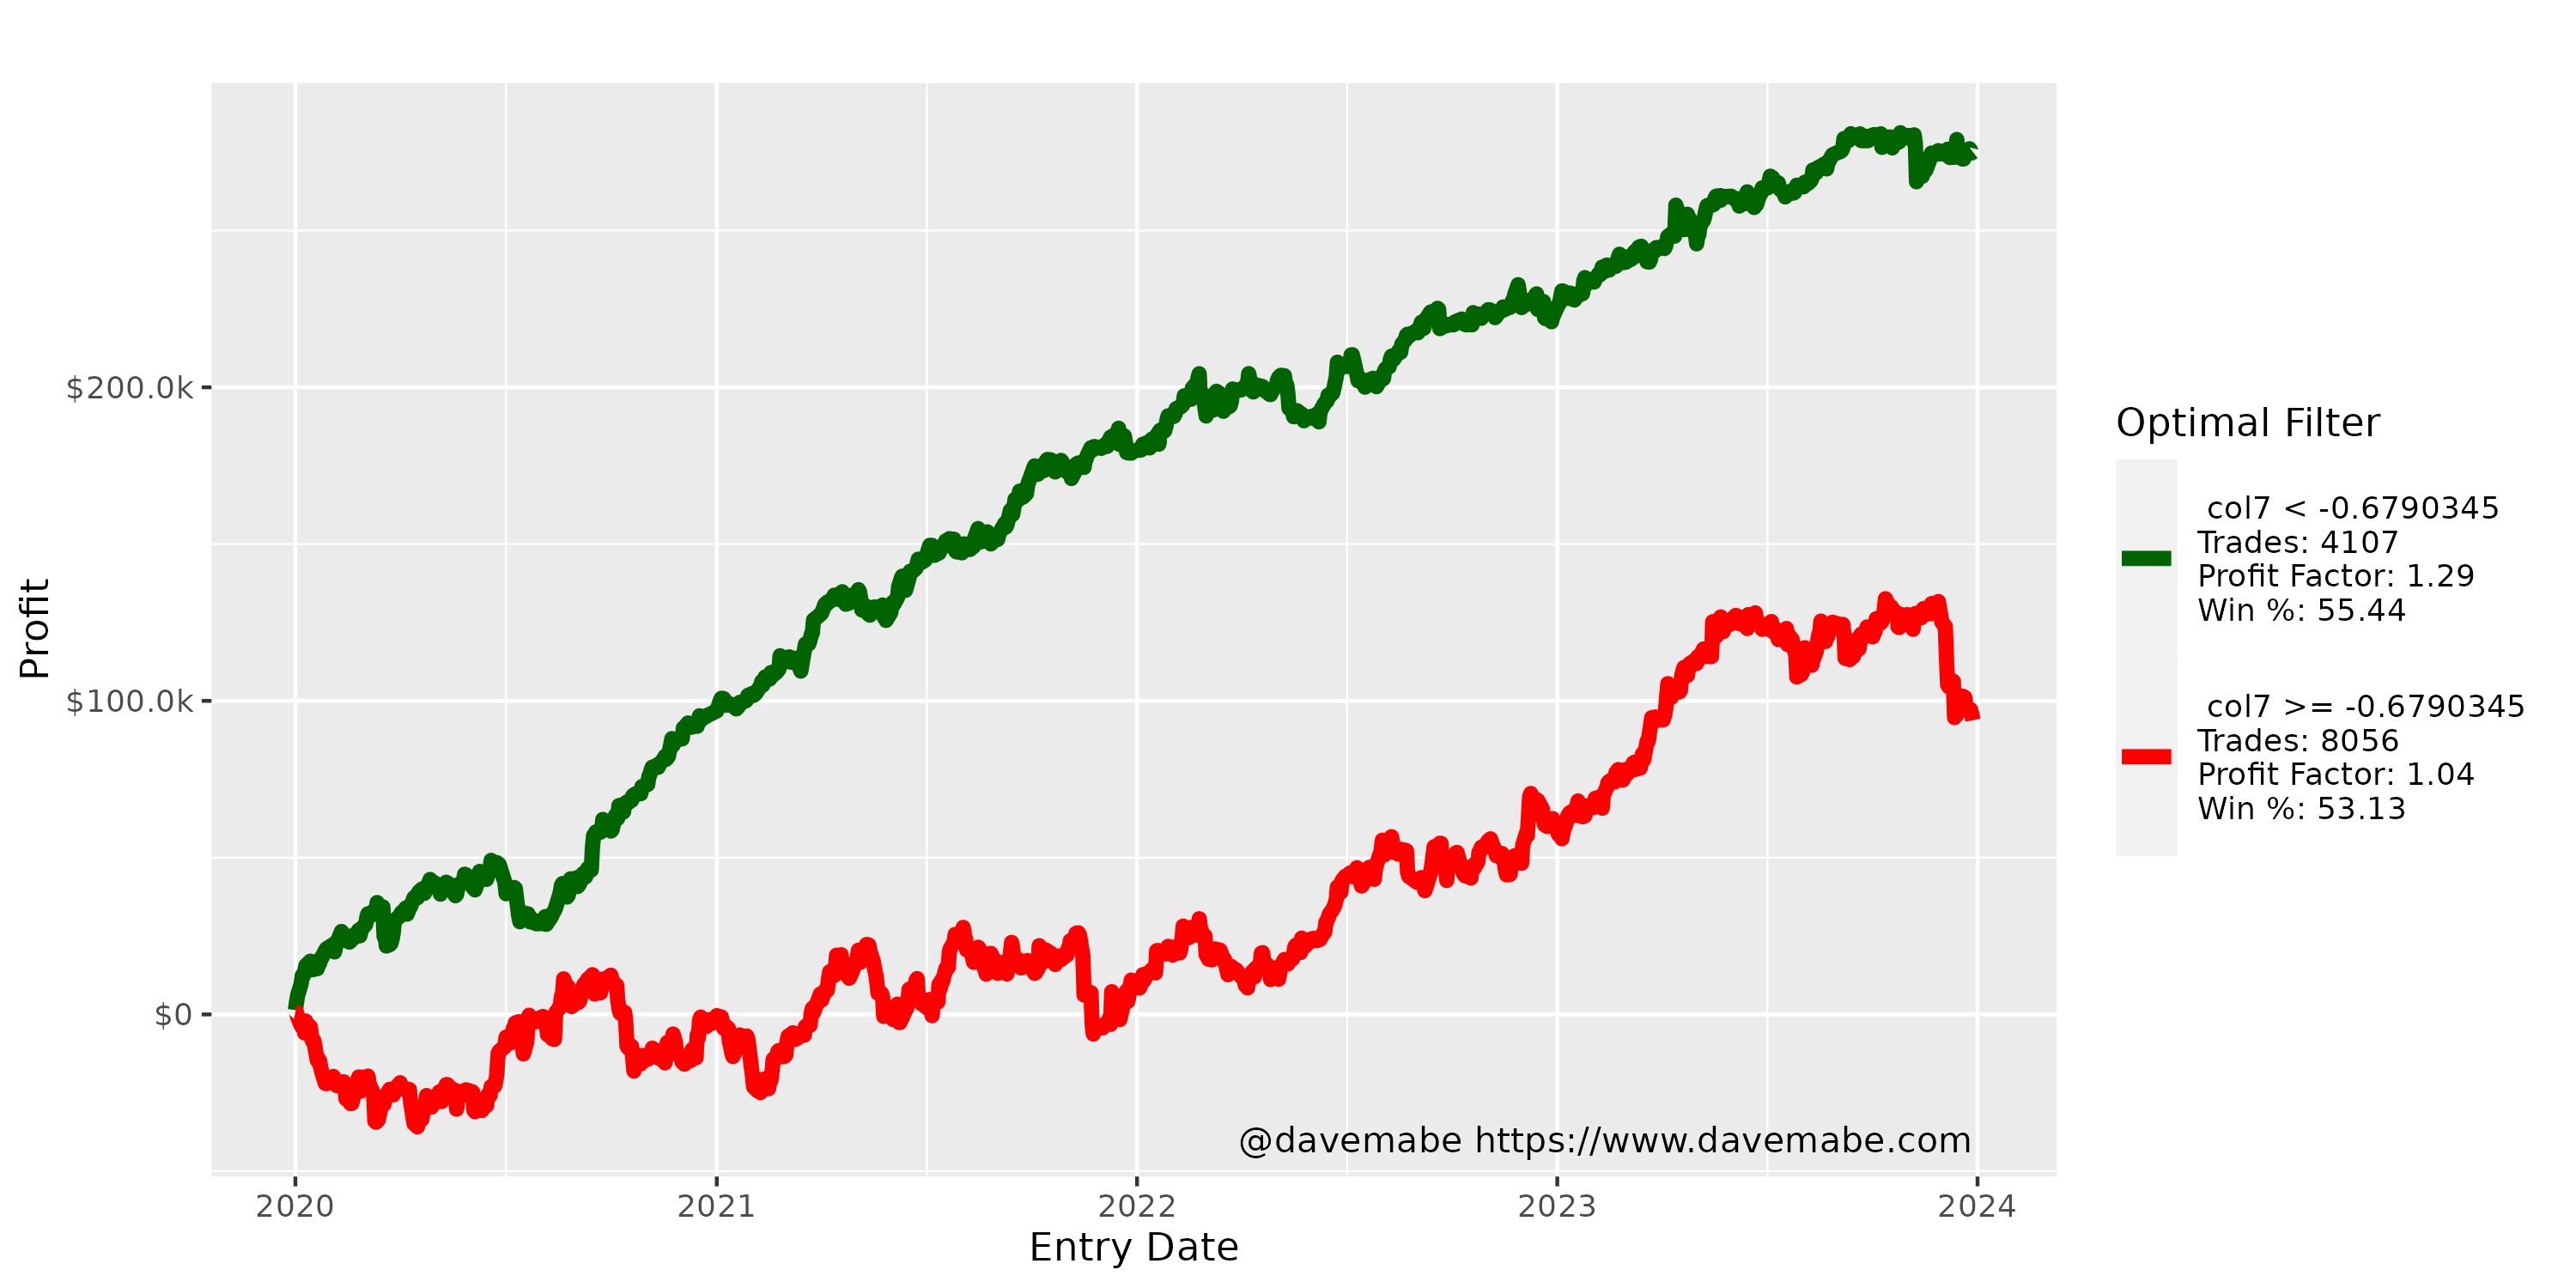
| Metric | Better | Worse |
|---|---|---|
| Trades | 4,107 | 8,056 |
| Total Profit | $275,051 | $93,832 |
| Profit Factor | 1.29 | 1.04 |
| Win Rate | 55.4% | 53.1% |
| Calmar | 10.37 | 1.88 |
col6
Condition: col6 < -2.4066
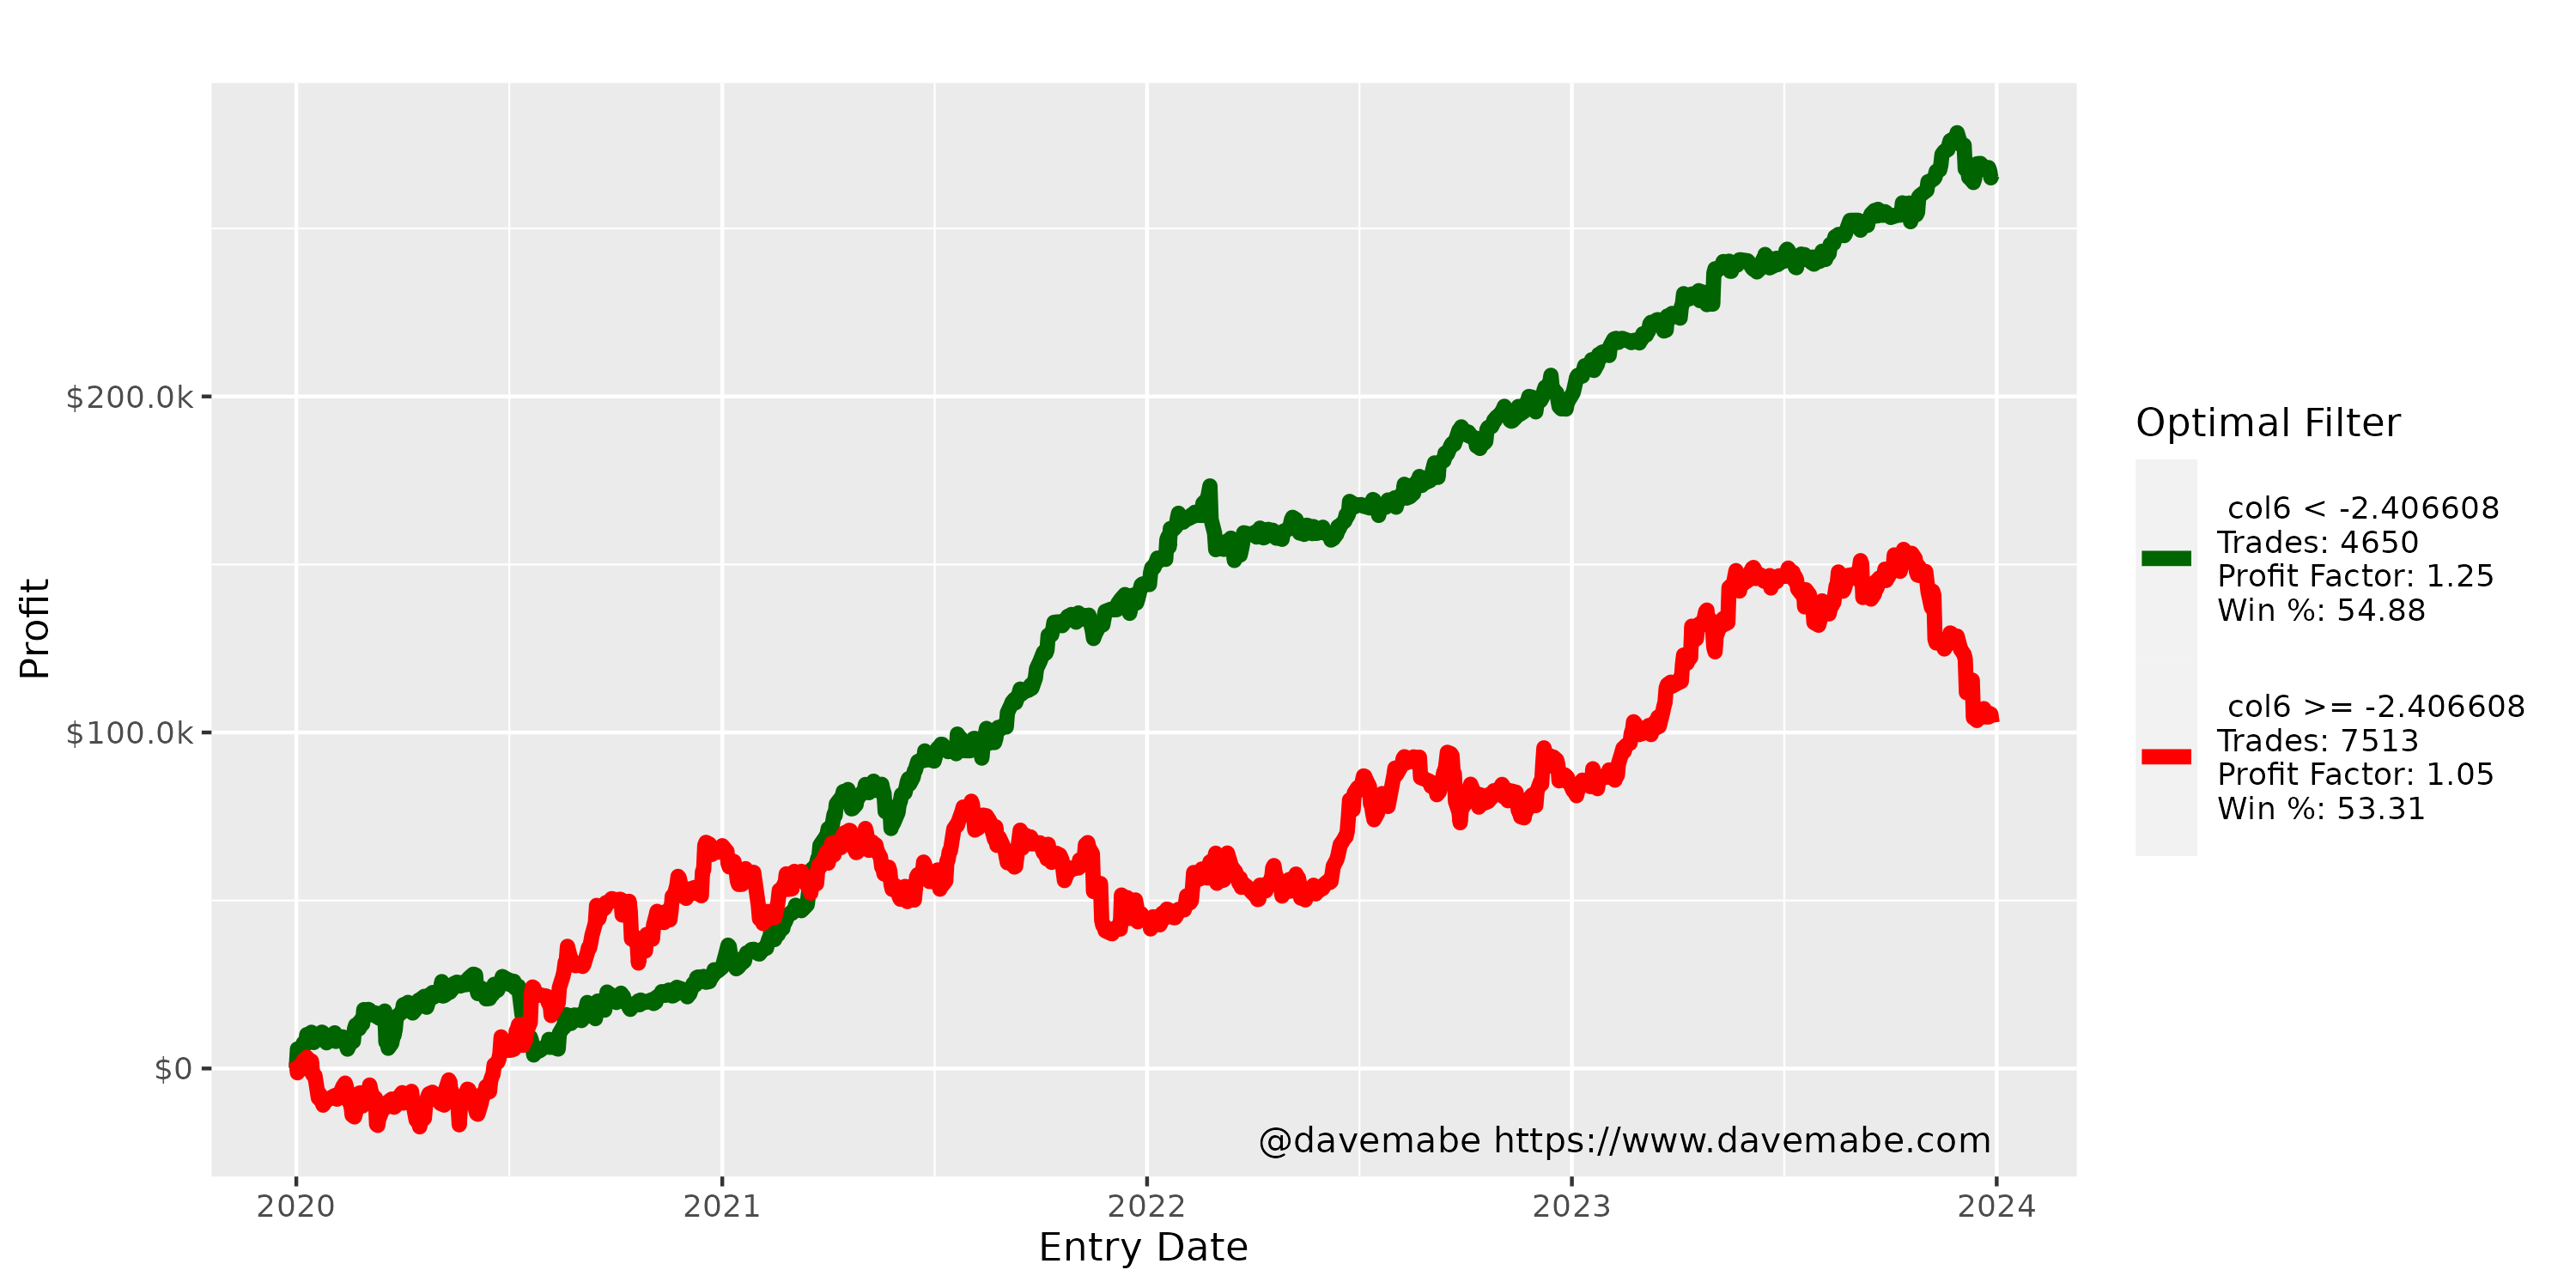
| Metric | Better | Worse |
|---|---|---|
| Trades | 4,650 | 7,513 |
| Total Profit | $266,004 | $102,879 |
| Profit Factor | 1.25 | 1.05 |
| Win Rate | 54.9% | 53.3% |
| Calmar | 13.21 | 1.70 |
col3
Condition: col3 >= 4.0547
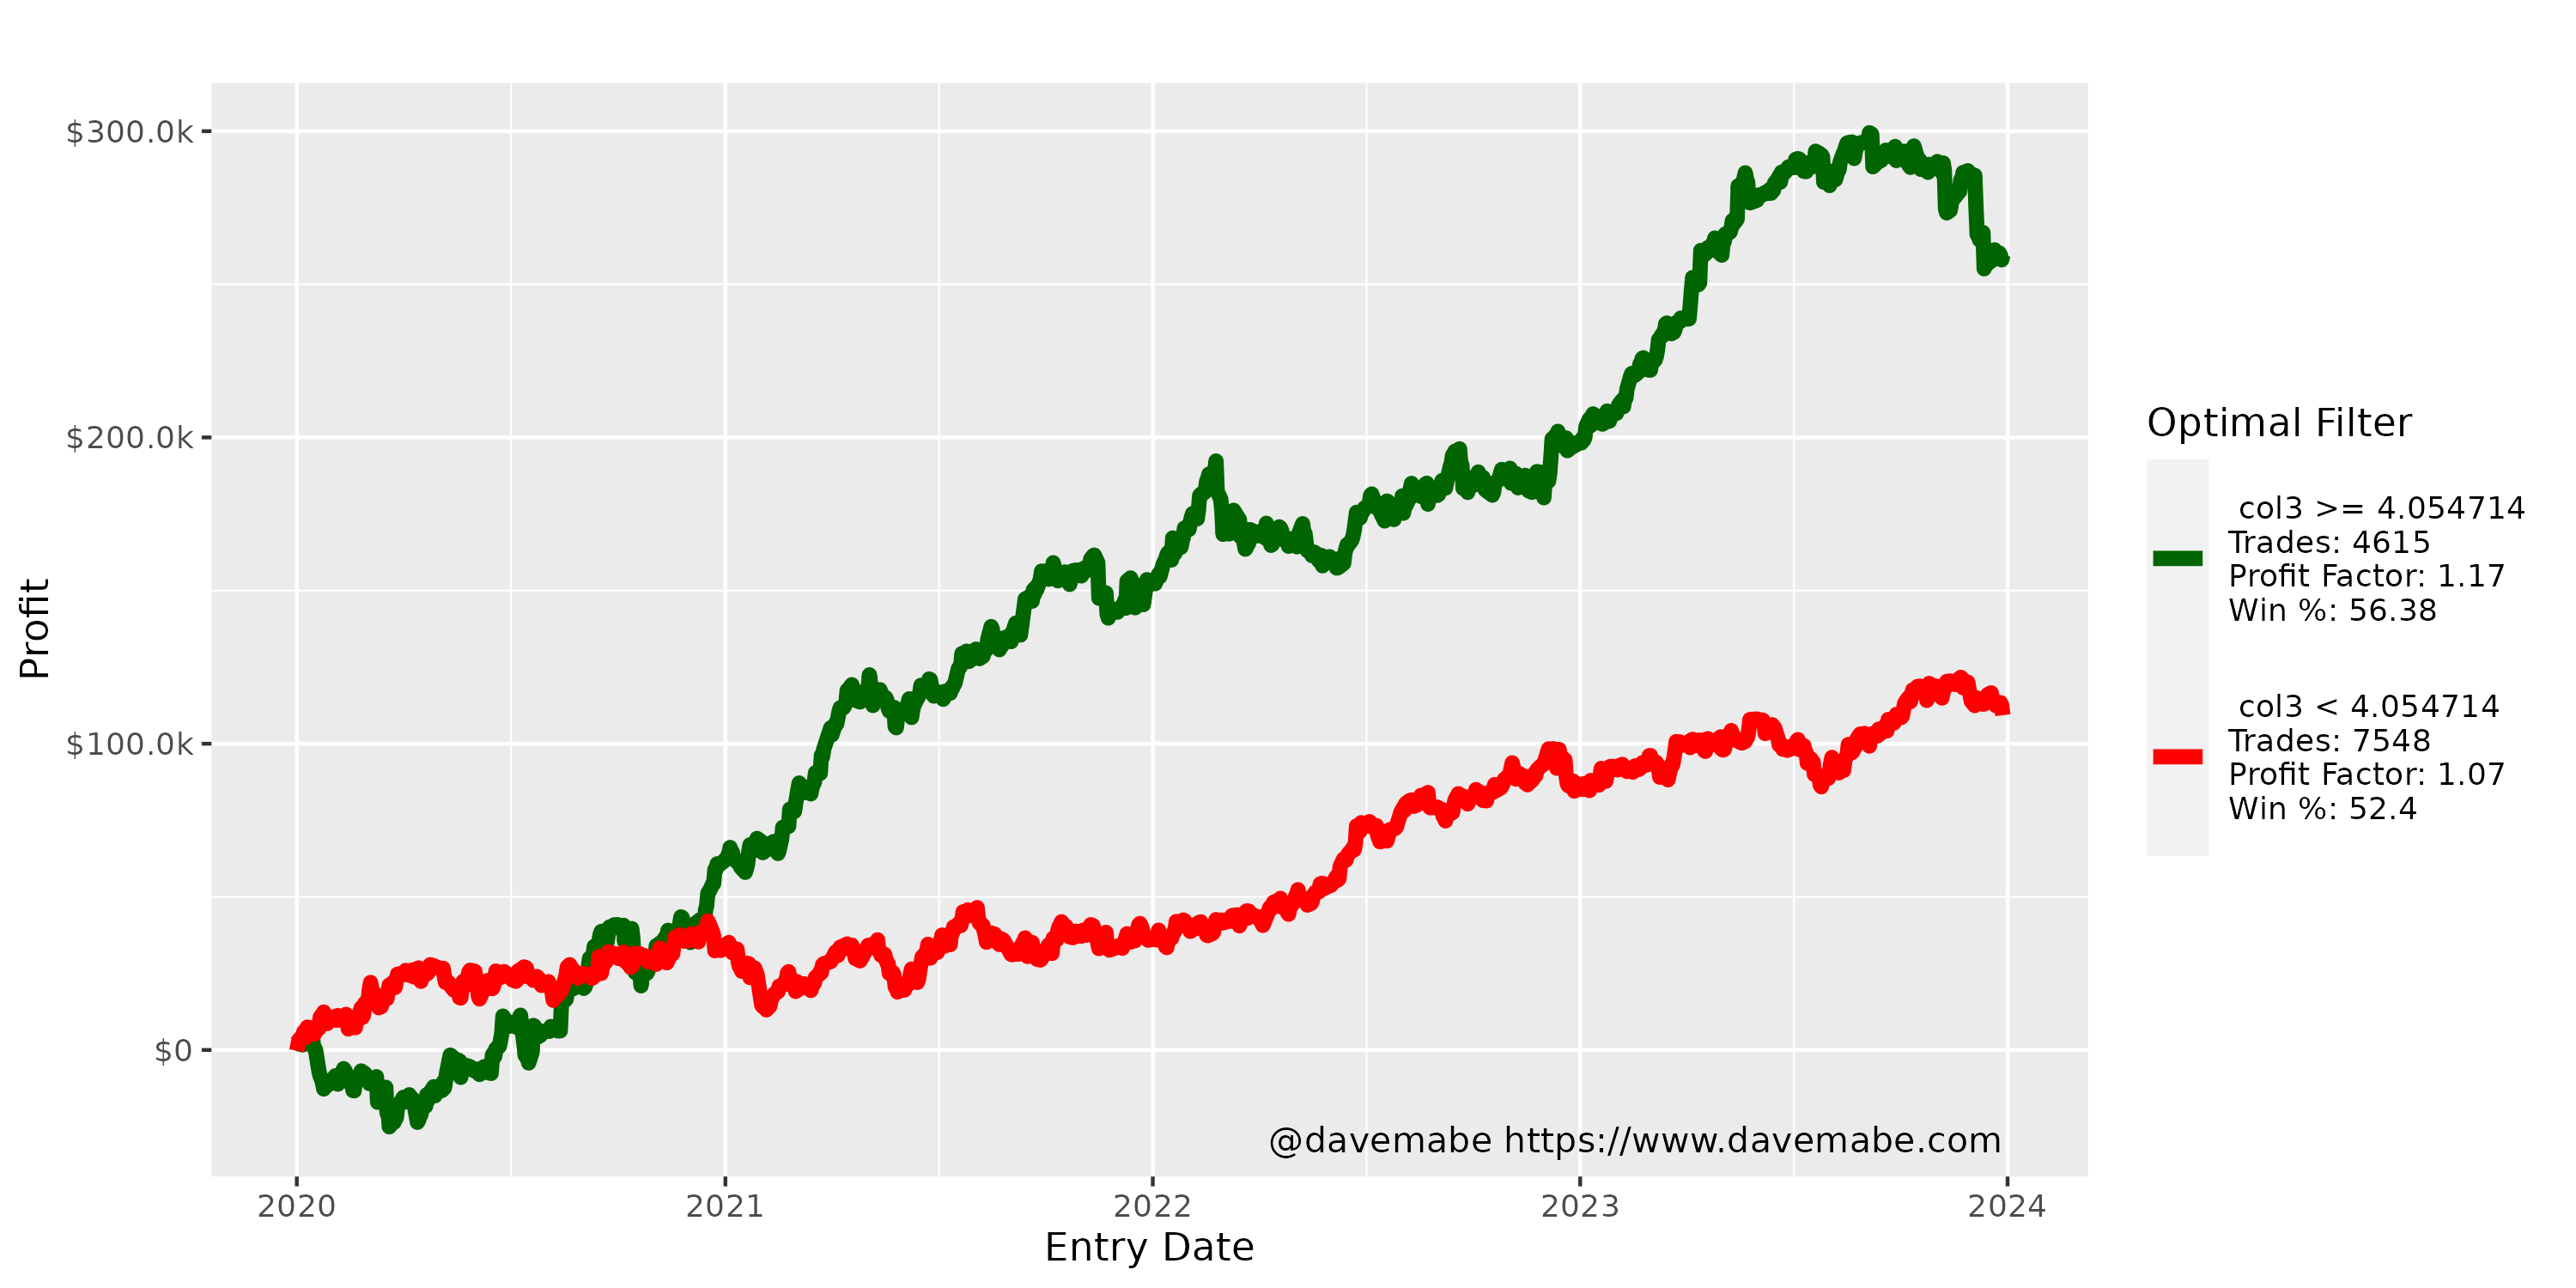
| Metric | Better | Worse |
|---|---|---|
| Trades | 4,615 | 7,548 |
| Total Profit | $259,582 | $109,301 |
| Profit Factor | 1.17 | 1.07 |
| Win Rate | 56.4% | 52.4% |
| Calmar | 5.65 | 3.42 |
col5
Condition: col5 < 2.0351
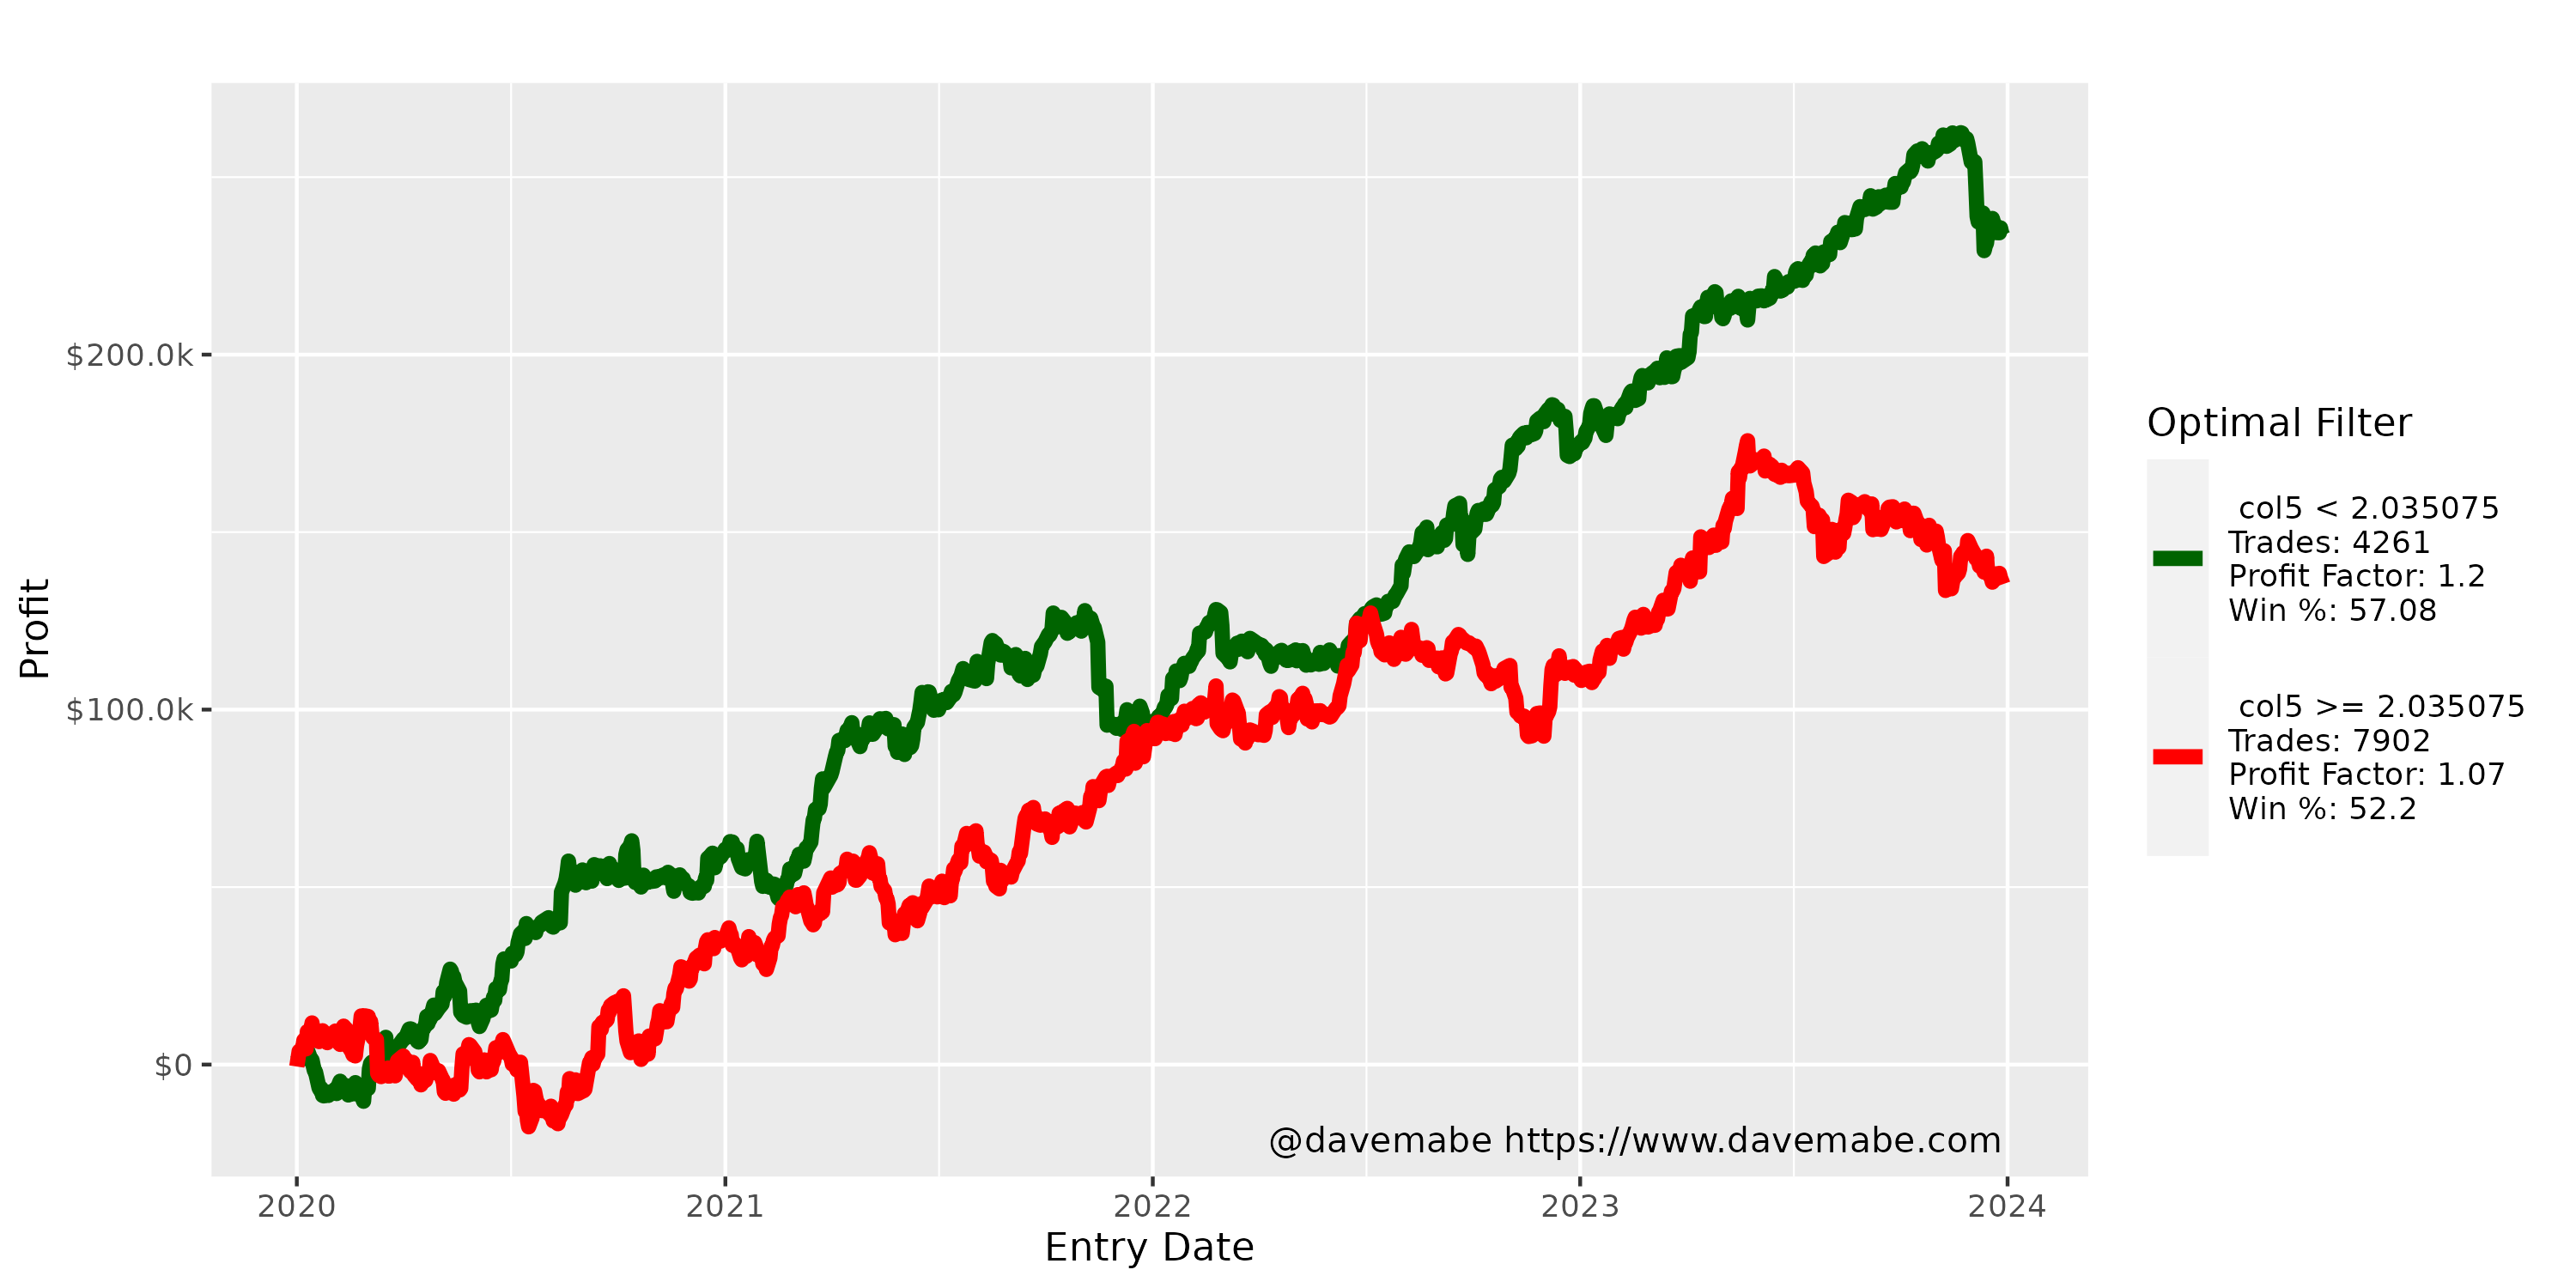
| Metric | Better | Worse |
|---|---|---|
| Trades | 4,261 | 7,902 |
| Total Profit | $233,559 | $135,323 |
| Profit Factor | 1.20 | 1.07 |
| Win Rate | 57.1% | 52.2% |
| Calmar | 7.03 | 2.31 |
col4
Condition: col4 < 2.8050
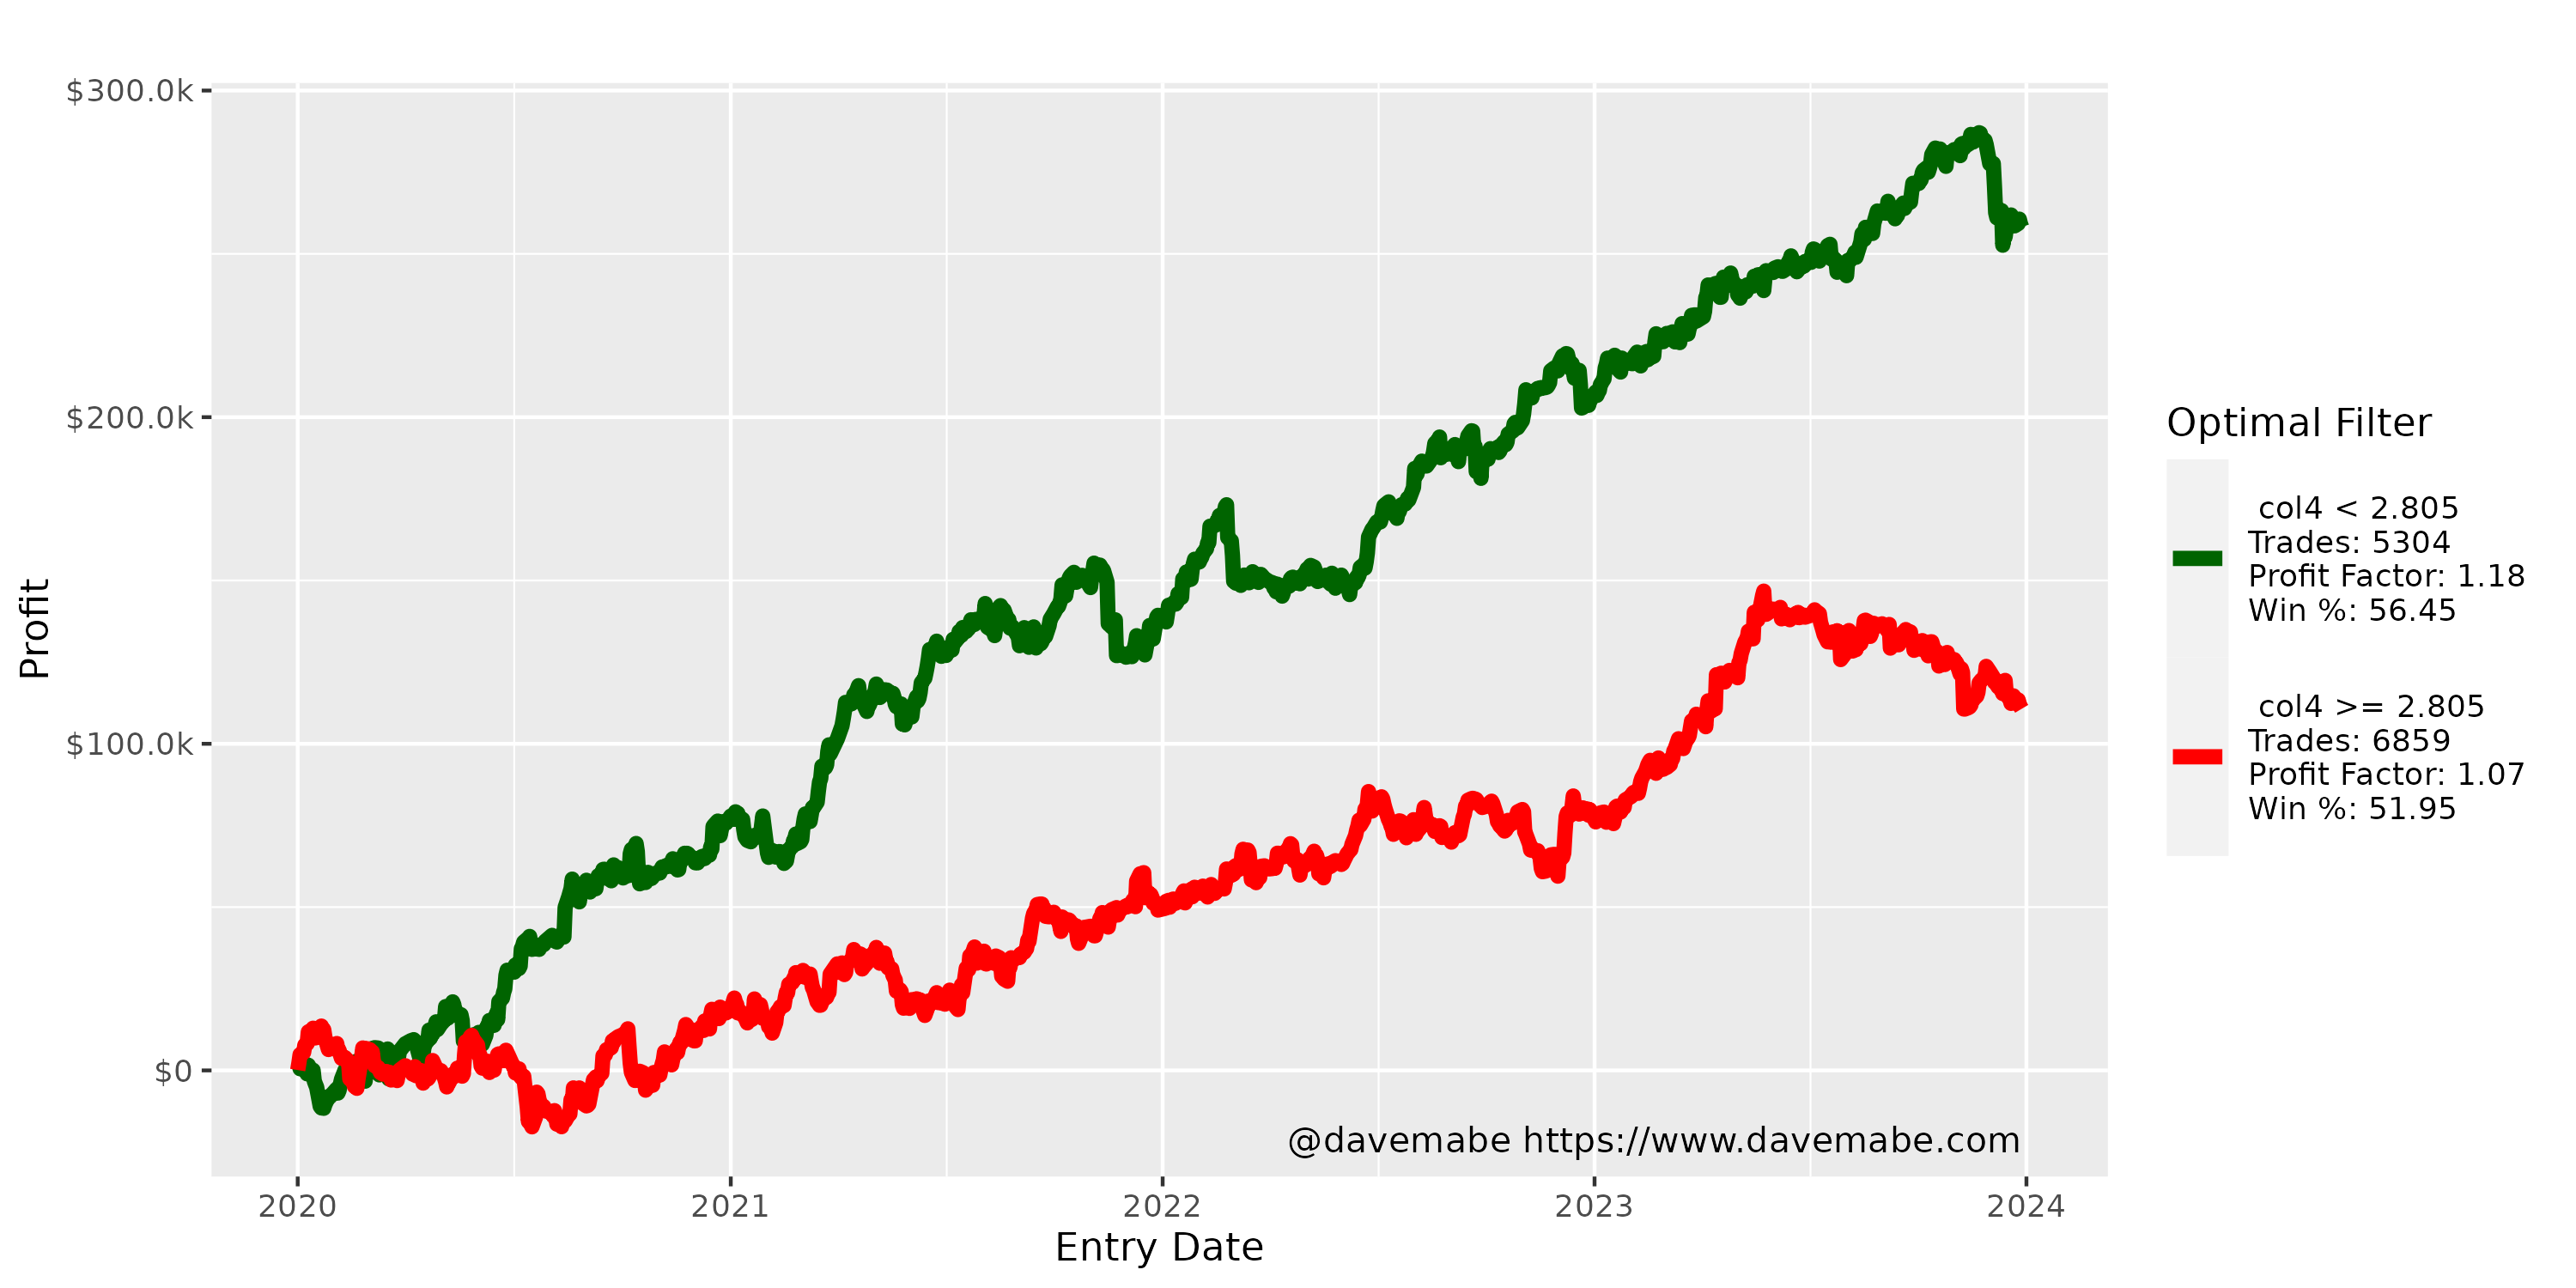
| Metric | Better | Worse |
|---|---|---|
| Trades | 5,304 | 6,859 |
| Total Profit | $258,173 | $110,710 |
| Profit Factor | 1.18 | 1.07 |
| Win Rate | 56.5% | 52.0% |
| Calmar | 6.75 | 1.78 |
col1
Condition: col1 < 0.2309
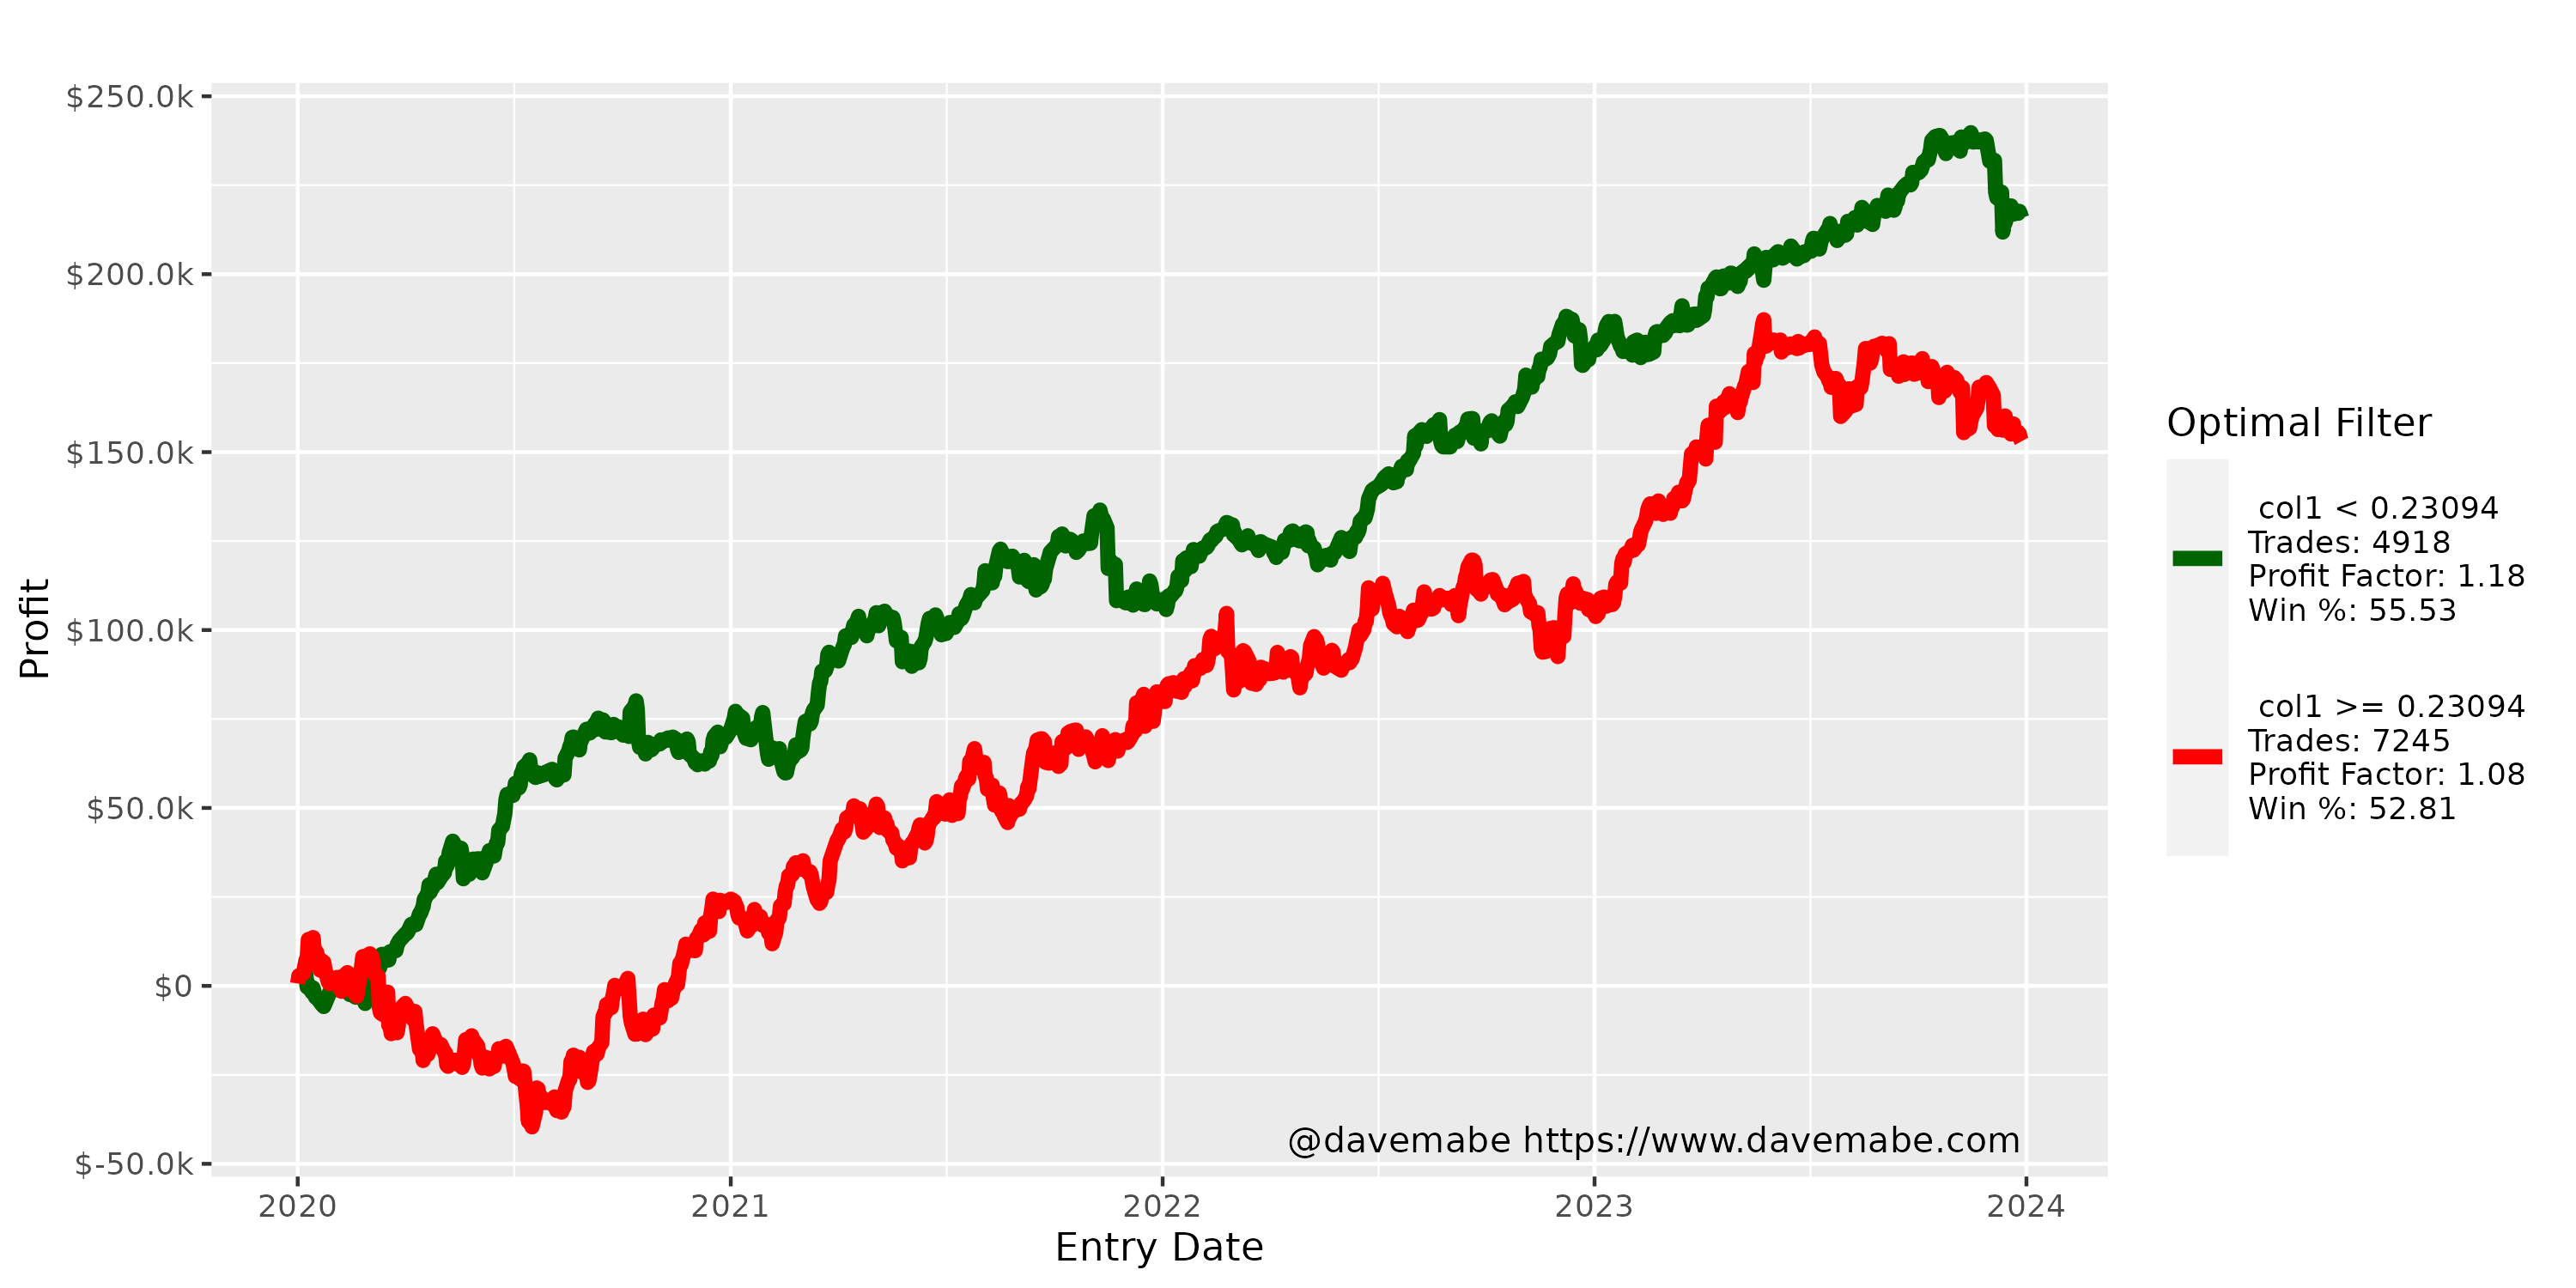
| Metric | Better | Worse |
|---|---|---|
| Trades | 4,918 | 7,245 |
| Total Profit | $215,832 | $153,051 |
| Profit Factor | 1.18 | 1.08 |
| Win Rate | 55.5% | 52.8% |
| Calmar | 6.93 | 2.19 |
col2
Condition: col2 < 1,249,316.0000
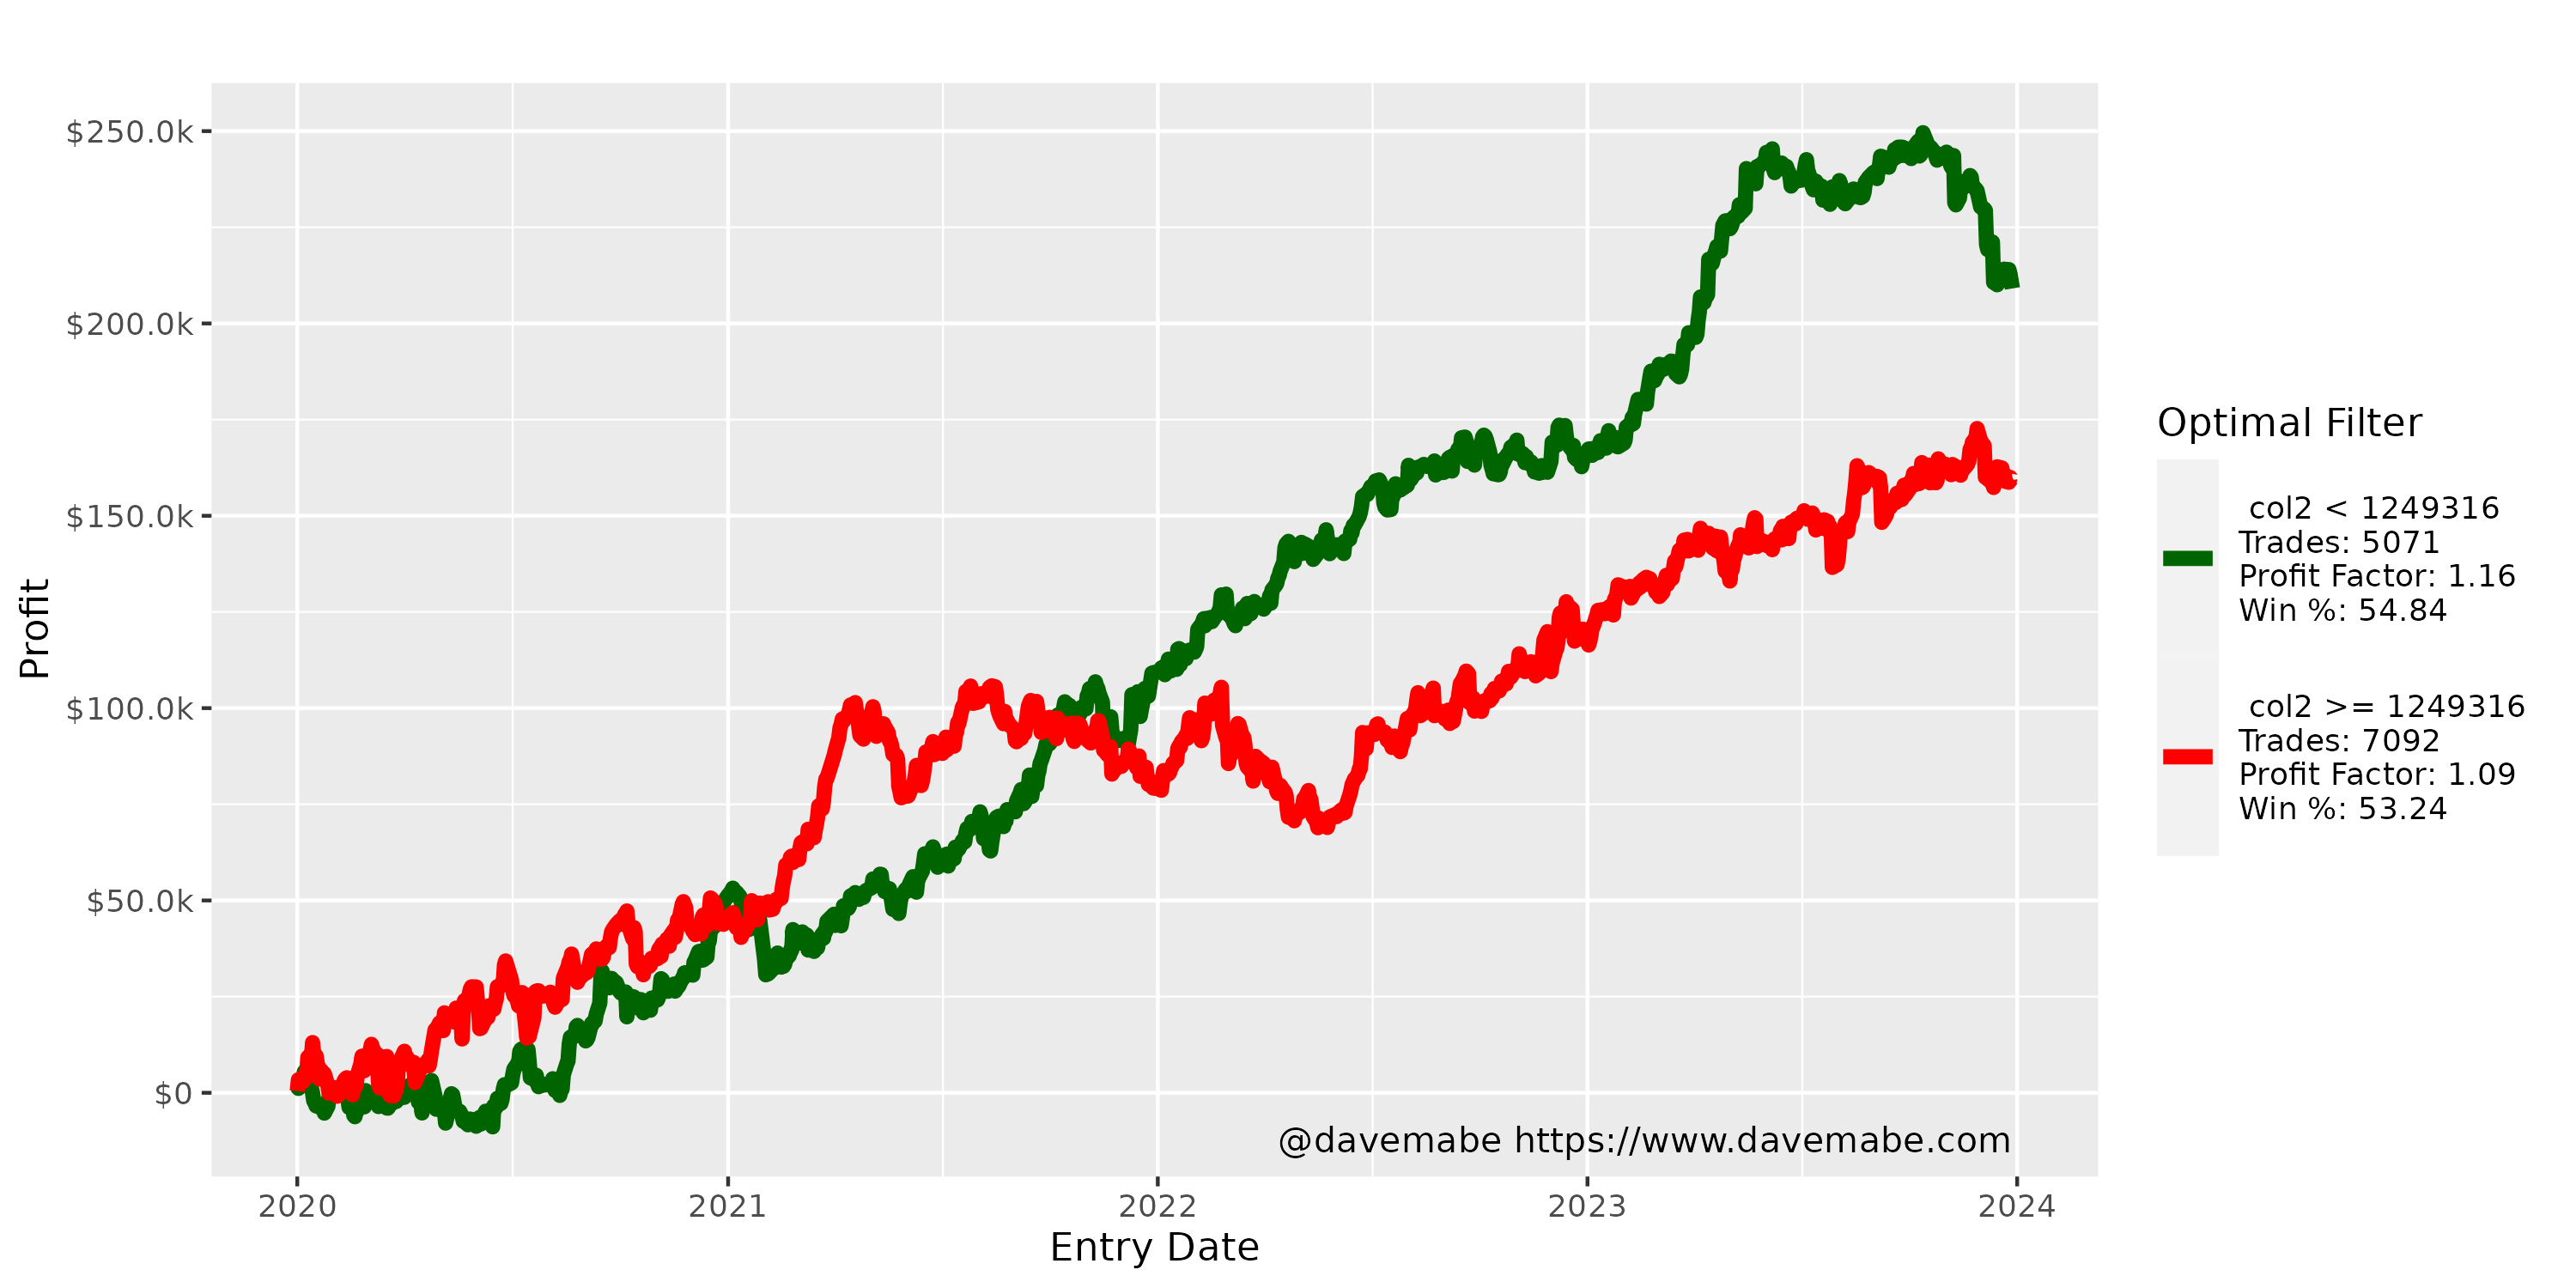
| Metric | Better | Worse |
|---|---|---|
| Trades | 5,071 | 7,092 |
| Total Profit | $209,102 | $159,781 |
| Profit Factor | 1.16 | 1.09 |
| Win Rate | 54.8% | 53.2% |
| Calmar | 7.22 | 2.80 |