Welcome to the MabeKit Strategy Cruncher
Understand how the Strategy Cruncher works.
To use the MabeKit Strategy Cruncher, you'll upload Trade files from your backtesting software.
Step One - Download a Sample File
Here's a sample file with anonymized data from one of my backtests. You can download this file to use for your first optimization.
Step Two - Create a New Optimization
Click on the New Optimization button in the top right part of the page.
This will take you to the Create New Optimization page. Enter a name for your optimization (it can be anything).
Click the Choose File button and point to the file you downloaded in Step One.
Step Three - Submit Your Optimization
When you click Create Optimization, it will take you to the confirm screen where you can change some settings. Accept the defaults and click the Submit Optimization button.
Step Four - Observe Your Optimization
When your optimization is submitted, you'll see an entry in your optimization list with the status of Queued.

The Strategy Cruncher will process your optimization and create your report. In a few seconds, you'll see the status go from:
- Queued
- Processing
- View
When you see the View link, the report is complete and you can click on it to view the optimization report.
Step Five - View the Optimization Report
Once your optimization report is ready, simply click on the View link to view it. When you view the optimization report from the sample CSV provided above, it will look similar to this report:
Optimization Report from Sample CSV
There is a section at the top of the report called Baseline, then a section called Top Columns which list of suggestion filters to apply to your strategy to improve the profitability.
They are in descending order by importance, so focus on the suggestions at the top of the report first.
You can sort the suggestions by using the Sort by buttons above the suggestions.
For each suggestion, there is an equity curve in the section below showing what the equity curve would look like if you applied that particular rule to your backtest.
In the sample report in the Top Columns section, the first suggestion for a potential filter is col8 using a minimum value of 10.38:
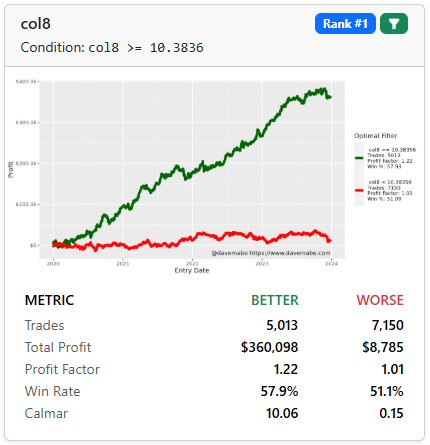
Each suggestion will have:
- Equity curves showing your backtest if the rule is applied (green line) and the trades that would be removed (the red line)
- The exact rule to apply to your strategy
- The Rank of the suggestion in the list (Rank #1, Rank #2, etc)
- A Filter button (green filter icon) to apply the particular filter and run another optimization
- A metric table to compare against the Baseline at the top of the report
The Metric table has these elements, broken down by BETTER (remaining trades by applying the rule) and WORSE (trades removed by applying the rule):
| Metric | Description |
|---|---|
| Trades | Total number of trades in the set in the backtest period. |
| Total Profit | Sum of all profits and losses from trades in the set. |
| Profit Factor | Gross profits divided by gross losses. Values > 1 indicate profitability. |
| Win Rate | Percentage of trades that were profitable. |
| Calmar | Total return divided by maximum drawdown. Higher is better. |
Go to the next lesson to learn how to interpret the report.